Request a Demo
According to market data released by MFDS on August 26th, 2019, South Korea’s food production scale reached 78.9 trillion (78.9 x 10¹²) South Korean Won (SKW), which is 6.67 billion US dollars, in 2018, 5.1% higher than that achieved in 2017, with an average annual growth rate of 3.7% recorded over the last three years. The food sector accounted for 16.3% of domestic manufacturing production value and 4.4% of South Korea’s GDP.
 *Food industry here includes the manufacturing and processing of food (including processed food products, food additives), livestock products (meat, prepackaged meat, processed dairy products, and processed egg products), health functional food and containers/packages.
Food Industry Production Data
Production Value of Four Major Categories
Among all the major food categories, food and food additive sector remained the top category, followed by livestock products and the manufacturing of containers or packaging. As revealed by an MFDS report, the increasing production of packaging and containers is mainly due to increasing packing demand for ready-to-eat food and packaged meat products. Health functional foods ranked number 4. The functional food sector is characterized by high demand and boasted a YOY growth rate of 16.7% in 2018.
| Production Value (unit: billion SKW) Manufacturers | 2016 | 2017 | 2018 | Annual average growth rate, from 2016-2018 (%) | YOY growth rate compared to 2017(%) |
| Food (including food and food additive) | 41,853 | 42,768 | 45,297 | 4.0 | 5.9 |
| Health functional food | 1,471 | 1,482 | 1,729 | 8.4 | 16.7 |
| Livestock products | 24,008 | 24,732 | 25,093 | 2.2 | 1.5 |
| Container/packaging | 5,981 | 6,076 | 6,789 | 6.5 | 11.7 |
| Total | 73,313 | 75,058 | 78,907 | 3.7 | 5 |
Key Features of 2018 South Korea’s Food Industry Production Performance
[Food]
Meat product production in the ascendency
Ready-to-eat food continues to grow
According to the MFDS data (shown below), packaged pork, beef and prepared meat remained the top 3 food categories. In addition, ready-to-eat food and convenience food recorded sustained growth, with a YOY growth rate of 13.7% in 2018.
The increasing production value of convenience food, prepackaged meat and prepared meat (with YOY growth rate of 10.3% in 2018), as well as a decline in ham production (YOY growth rate: -10%), were mainly due to a falling birthrate and the concomitant increase in the prevalence of single-person households. Convenience is a major driver of demand amongst South Korean consumers.
Top 20 Well-performed Food Categories (unit: billion SKW)
[Beverage]
Processed dairy maintains the downward growth trajectory
Korean liquor “Soju” and imported beer see production rise
The production of carbonated soft drinks was greatly influenced by hot weather
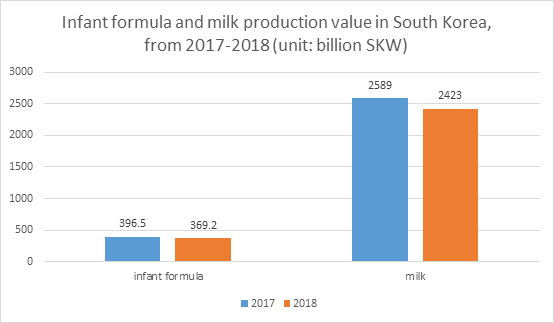
Dairy—The production value of dairy beverages declined. The production value of milk declined by 6.4% while the production value of fermented dairy and processed dairy decreased by over 20% in 2018. It's also worth noting that infant formula production value reduced by 6.9% in 2018, influenced by Korea’s declining birth rate. (South Korea Dairy Products Regulation HERE)
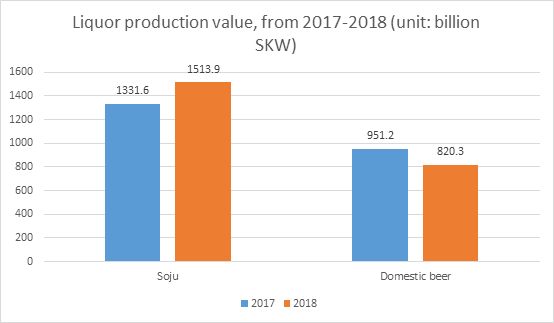
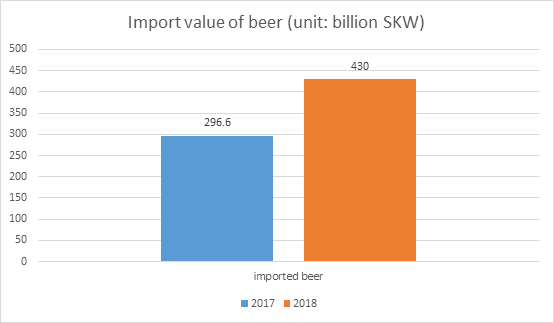
Liquor—The production performance of liquor reached 3.4 trillion SKW in 2018, 2.1% higher than that in 2017. According to the MFDS data, beer and Soju are still the two main alcoholic beverages. The production value of domestic beer decreased by 13.8% compared to 2017, but this decline was eclipsed by the impressive growth seen in imported beer which increased by 45% and reached 430 billion SKW in 2018.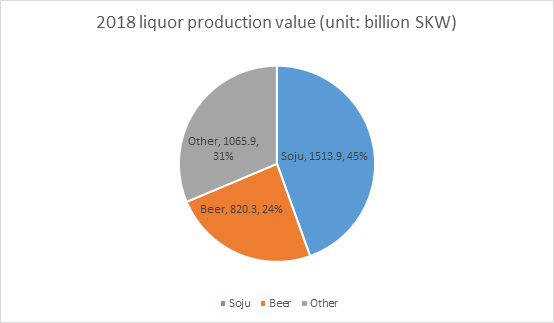
Coffee—In 2018, the production value of liquid coffee (canned coffee, etc.) increased by 29.6%; roast coffee increased by 5.2%, while the performance of instant coffee declined slightly.
Carbonated soft drinks—The carbonated soft drink industry was greatly influenced by the hot summer weather. Although the production value increased by 21.5% in 2018, this is better understood as a rebound from a major decline of 21.3% recorded in 2017. The number of hot days when the temperature hit over 33 ℃ was 22.4 days in 2016, 14.4 days in 2017 and 31.5 days in 2018. These fluctuations in annual weather correlate exceedingly well with the fluctuations recorded in carbonated drink production value.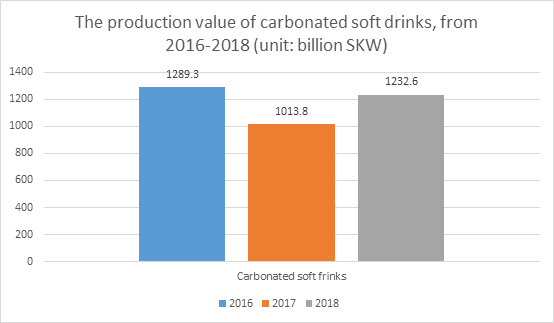
[Health functional food]
Red ginseng retains top spot amongst health functional food products
Probiotic products are experiencing rapid growth
The production value of the health functional food sector grew 16.7% in 2018 and achieved a production value of 1728.8 billion SKW.
-Among all health functional foods, red ginseng accounts for 39.1% of sector value, 28.6% higher than last year.
-The production value of probiotic products increased by 27% in 2018.
Top 5 Health Functional Food Performance (Unit: billion SKW)
| Food Production Performance 2017 | Production Value | The proportion of the whole food production value (%) | Food Production Performance 2018 | Production Value | The proportion of the whole food production value (%) | ||
| 1 | Red ginseng | 526.1 | 35.5 | 1 | Red ginseng | 676.5 | 39.1 |
| 2 | Approved by MFDS minister separately | 221.6 | 15.0 | 2 | Approved by MFDS minister separately | 245.3 | 14.2 |
| 3 | Vitamin and dietary minerals | 190.1 | 12.8 | 3 | Vitamin and dietary minerals | 213.6 | 12.4 |
| 4 | Probiotics | 149.5 | 10.1 | 4 | Probiotics | 189.8 | 11.0 |
| 5 | Milk thistle (Cardus marianus) extract | 73.9 | 5.0 | 5 | Oil containing EPA and DHA | 53.6 | 3.1 |
| Total (top 5) | 1161.1 | 78.4 | Total (top 5) | 1378.8 | 79.8 | ||
As for imported health functional food, the import value reached 672.7 billion SKW in 2018, 17.1% higher than that in 2017. Vitamin and dietary minerals occupied 34%, EPA and DHA products occupied 15.3% and probiotics occupied 11.2%.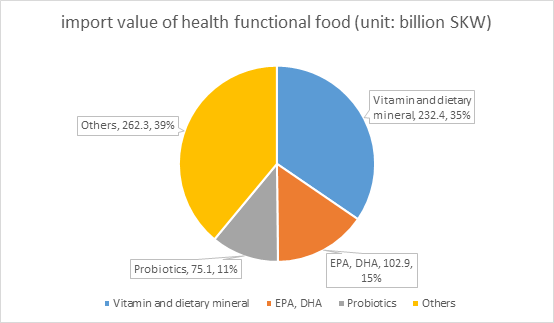
Top countries exporting health functional food to South Korea
1. USA 403.8 billion SKW (60%)
2. Canada 64.3 billion SKW (9.6%)
3. India 26.8 billion SKW (4.0%)
 We provide full-scale global food market entry services (including product registration, ingredient review, regulatory consultation, customized training, market research, branding strategy). Please contact us to discuss how we can help you by